Articles and Briefings
Year One of Trump’s DOJ: An Overview of the Four Major Categories of Offenders
Aug 08 2019
This article is the second in a series analyzing the Sourcebook of Federal Sentencing Statistics for Fiscal Year 2018, recently released by the United States Sentencing Commission. As discussed in our first article, the Sourcebook revealed an increase in the overall number of federal criminal offenders from the numbers seen in FY2017 – the first increase in offender numbers since FY2011. (See here and here for our previous analysis of the national numbers.) In this article, we discuss how the FY2018 offenders can be categorized by type of crime and what those numbers reveal about the prosecutorial priorities of the U.S. Department of Justice during its first full fiscal year under the Trump administration.
Click here* to read a disclaimer about the data contained in the FY2018 Sourcebook.
In the FY2018 Sourcebook, the Commission breaks out the offenses committed into thirty different categories by type of crime. Of these thirty categories, there are four categories that make up over 80% of the total number of offenders. These categories in FY2018 were immigration, drugs, firearms, and fraud-related financial offenses.
Immigration offenses include unlawfully entering or remaining in the United States, alien smuggling offenses, and offenses related to passports, naturalization documents, and other entry documents.
Drug offenses include illegal controlled substance trafficking, manufacture, and possession offenses.
Firearms offenses include the unlawful possession, transfer, or use of firearms, ammunition, and explosive materials.
Fraud and related financial offenses include fraud, theft (including identity theft), embezzlement, insider trading, and stolen or damaged property offenses.
Here is a breakout of the numbers for these categories in FY2018, as a percentage of the total national caseload:
Among the 17.2% of offenses not represented in these four major categories, the most prominent crimes include robbery (2.5%), child pornography (2.0%), money laundering (1.9%), and sexual abuse (1.5%).
Here is an overview of some of the FY2018 statistics for the four major offense categories described above:
After four years as the second largest offender category (behind drug offenders), immigration offenders made up the largest part of the FY2018 federal criminal caseload, with 23,883 offenders. Immigration offenders as currently defined by the Commission represented 34.4% of the national offender numbers in FY2018, an increase from 30.5% in FY2017. The increase in immigration numbers during FY2018 was the largest increase within the four major categories. As we noted in a previous article, DOJ has announced that immigration prosecutions are a high priority.
The percentage of the national caseload represented by immigration offenders in FY2018 (34.4%) was the second highest overall percentage for immigration since the Commission began reporting sentencing statistics in FY1990, only slightly behind the all-time reported high in FY2011 when immigration offenders made up 34.9% of the total national offender caseload. The FY2018 34.4% figure for immigration offenders also represents the largest percentage for any single offense category since FY2011.
The great majority (82.4%) of the FY2018 immigration offenders were sentenced for unlawfully entering or remaining in the United States. This figure represents a slight increase from FY2017 (when 81.5% of immigration offenders were sentenced for unlawfully entering or remaining in the United States). The FY2018 number also represents the highest percentage of enter/remain immigration offenders ever reported by the Commission. The next most prominent groups of immigration offenders in FY2018 were those sentenced for alien smuggling, which made up 12.8% of immigration offenders, and those sentenced for acquiring fraudulent immigration documents, which made up 4.2% of the immigration offenders.
The Commission recently released an interim report detailing statistics from the first six months of FY2019. This update shows that immigration offenses have continued to increase since FY2018 – 37.2% of the total offenders sentenced during the first half of FY2019 were immigration offenders.
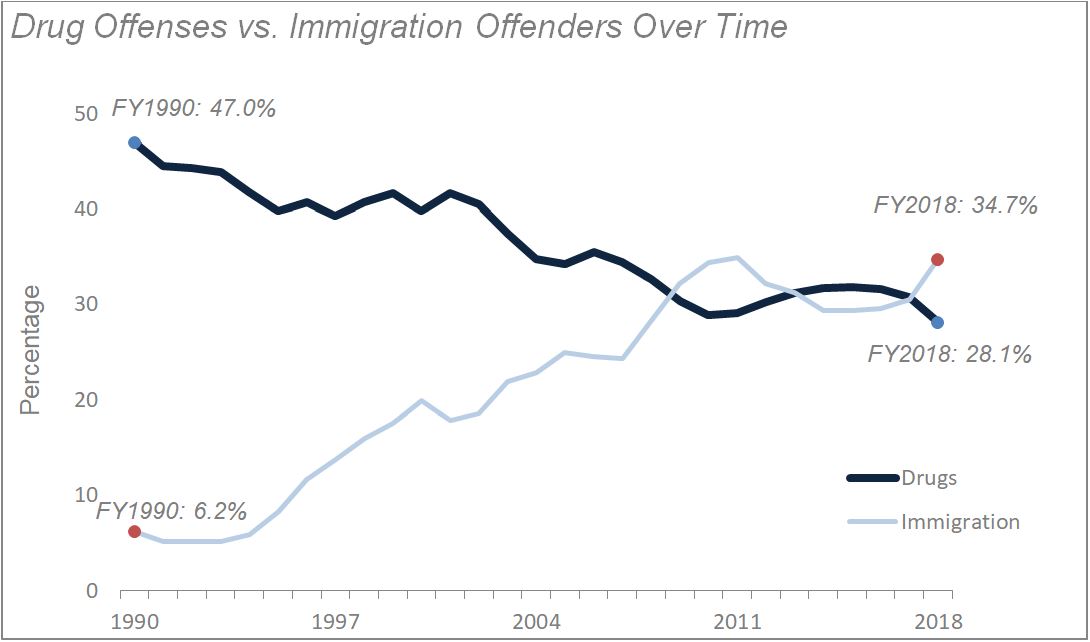
Drug offenders as currently defined by the Commission were the second most common offense category in FY2018 with 19,524 offenders, making up 28.1% of the total national federal offender caseload. This figure marks a decrease from the FY2017 percentage of 31.3%. While the percentage of federal drug offenders has stayed fairly steady during the ten years leading up to FY2018 (ranging from 28.1% to 31.8% of the total offender numbers), these more recent numbers represent a stark decrease from the percentages of federal drug offenders in the late 1990s and early 2000s, when the figures ranged from 37.4% to 41.7% of the total offender numbers. (The all-time high percentage of any single offense category reported by the Commission was in FY1990, when drug cases represented 47.0% of the total national offender caseload.) The update from the first half of FY2019 shows that the number of federal drug offenders has continued to decline – if the numbers hold, federal drug offenders will drop to 26.4% of the national caseload during FY2019.
The overall change in the number of federal drug offenders has largely mirrored the overall change in the number of immigration offenders over the same period. As the chart below shows, immigration offenders increased from 6.2% to 34.7% of the national offender caseload while drug offenders decreased from 47.0% to 28.1%.
Some of this decrease in the number of drug offenders can be attributed to the zero-sum nature of DOJ resources – the direction of increased effort toward offenses in one category will result in fewer offenses being prosecuted in other categories. But a part of this decrease is likely due to an increase in strategic prosecution of certain drug offenses in state court. In contrast to immigration offenses, which are crimes of exclusive federal jurisdiction, drug offenses are crimes of concurrent jurisdiction – they can be prosecuted either in state court or in federal court. In determining whether to prosecute a drug offense, federal prosecutors look at many factors, including whether the offense would likely be punished more seriously in state court or in federal court. Some state laws provide for harsher punishment for certain drug offenses than federal law does. For example, someone in North Carolina with no criminal record who possesses 28 grams of heroin is looking at a mandatory sentence under North Carolina law of 225-282 months in prison. In North Carolina’s federal courts, the guideline range for the same person with the same amount of heroin starts at 21-27 months. On the other hand, a person who has the highest level criminal record provided for under North Carolina law and who is in possession of 28 grams of crack cocaine is looking at a mandatory sentence under North Carolina law of 35-51 months in prison; the same person with the same amount of crack cocaine is looking at a federal advisory guideline range starting at 100-125 months.
This is not to say that there are fewer drug offenders than there used to be. To the contrary, the FBI reported that there was a 3.8% increase in drug arrests during FY2017 compared with FY2016; according to the FBI’s Uniform Crime Reports from FY2013-2017, drug arrests have also increased three out of the five previous fiscal years and increased during the first half of FY2018 when compared with FY2017. So the decline in the number of federal drug offenders does not mean that drug prosecutions as a whole have declined – just that more of them may be handled in state court than was previously the case.
The Commission also provides a breakdown of drug offenses based on the type of drug involved. Here is how the FY2018 drug offenders break out by drug type:
Included in the 8.1% of other FY2018 drug types not represented above are oxycodone/oxycontin (2.4% of offenders) and fentanyl (2.3% of offenders). The Commission first reported on fentanyl trafficking in FY2014, when there were nine of these offenses. Since FY2014, the number of federal fentanyl offenders has increased more than forty-fold; federal fentanyl offenses are apparently still on the rise, as the interim report shows that 3.8% of federal drug offenses during the first half of FY2019 involved fentanyl as the primary drug type. During FY2018, DOJ named a Director of Opioid Enforcement and Prevention Efforts and announced Operation Synthetic Opioid Surge (S.O.S.), a program designed to increase prosecution efforts in fentanyl and other synthetic opioid cases. This increase in fentanyl offender numbers is a product of this new enforcement emphasis.
The FY2018 methamphetamine numbers are the highest percentage for a particular drug since FY1992, when powder cocaine offenders made up 42.1% of the drug offender numbers. As the chart below shows, the percentage of methamphetamine offenses has increased more than sevenfold since the Commission began publishing sentencing statistics in FY1990 – from 5.3% of the federal drug offenders in FY1991 to 39.8% in FY2018. Methamphetamine offenders have made up the largest group of federal drug offenders every year since FY2014. The increase in the number of methamphetamine offenders is also likely related to increases in methamphetamine importation. Customs and Border Protection reports more than a 187% increase in the amount of methamphetamine seized by that agency since FY2014.
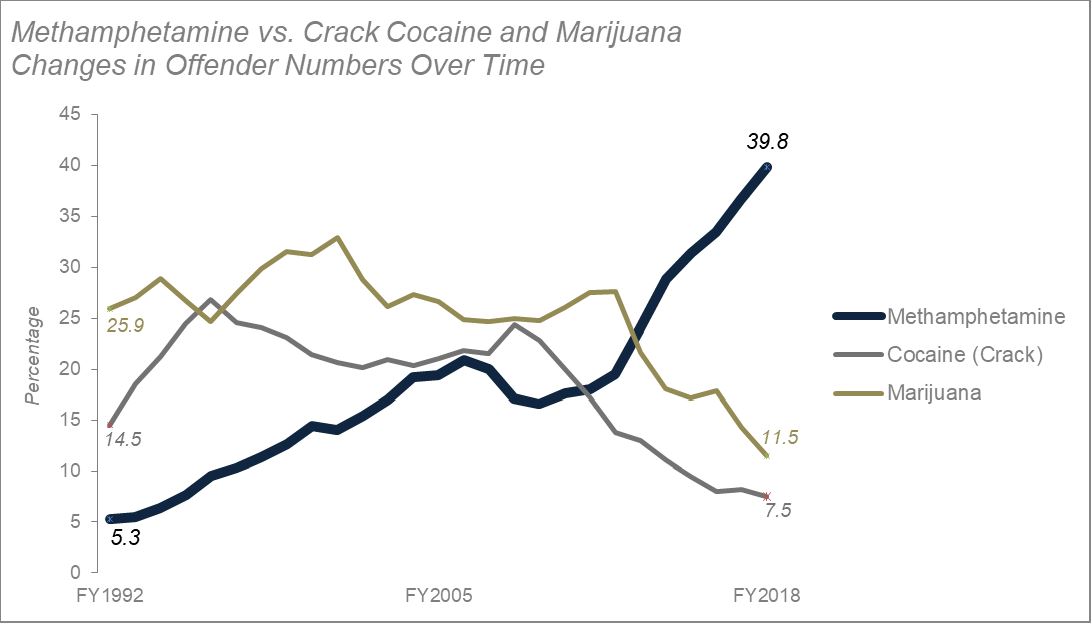
This increase in federal methamphetamine prosecutions has largely shifted priorities away from crack cocaine and marijuana offenses, which are both at all-time lows since the Commission began reporting sentencing statistics. Both crack cocaine and marijuana offender numbers have decreased by more than half from their highest reported levels: Crack cocaine cases were 26.8% of federal drug offenses in FY1996, while marijuana cases were 32.9% of federal drug offenses in FY2001.
The FY2019 interim report indicates that these trends are likely to continue; if the numbers hold in the second half of FY2019, methamphetamine offenders will increase to 40.8% of all drug offenders, while marijuana offenders will decrease to 9.3% of drug offenders, which would be the lowest percentage for marijuana offenders since the Commission began reporting these types of statistics.
Firearms : Firearm offenses (which are also concurrent jurisdiction crimes) made up 10.8% of the total national federal caseload, with 7,512 firearms offenders sentenced in FY2018. This is an increase from FY2017, when firearm offenders as they are currently defined by the Commission made up 10.1% of the national offender caseload. The percentage of firearms offenders during FY2018 was the highest since FY2015 and made up the largest percentage of the total offender caseload for firearms cases in at least the last ten years. The FY2019 interim report shows that the increase in firearms offenders is likely to continue – for the first half of this year, 11.7% of the total national offender caseload involved firearms offenses. Like with immigration prosecutions, DOJ has announced that firearms prosecutions are a high priority.
Almost all of the FY2018 federal firearms offenders committed an offense involving the unlawful possession of firearms, ammunition, or explosives – 94.2% of the total, which is consistent with historical trends. There were 2,564 offenders in FY2018 who were convicted of offenses involving the use of a firearm during or in relation to a drug or violent crime. This number is a 21.6% increase over the FY2017 number of offenders and is the highest number of these offenders since FY2007. Of these offenders, close to half (43.9%) used the instrument during or in relation to a federal drug offense, while slightly over one-fourth (25.9%) used it during or in relation to a federal robbery offense.
Fraud and related financial offenses : Offenders committing fraud and related financial offenses made up 9.5% of the FY2018 offender caseload. This figure represents a decrease from FY2017 numbers, when fraud offenders made up 10.5% of the national caseload. FY2018’s overall fraud offender numbers were the lowest reported since FY1990 and represent the all-time lowest reported percentage of the overall offender numbers. The FY2019 interim report shows that the decrease in fraud offenders is likely to continue – for the first half of this year, 8.8% of the total national offender caseload involved fraud offenses.
There is a broad range of loss amounts in the federal fraud, theft, and embezzlement offenses. Many of these offenses involve fairly small losses – 15.3% of the reported FY2018 offenses had loss amounts at or below $6,500. Close to one-third of the offenses (29.1%) had loss amounts between $40,000 and $250,000. While the median loss was $134,394, the mean loss was $6,271,059. This was the largest mean loss amount in fraud cases since the Commission began reporting loss amount statistics in FY2006. In FY2018, the gap between the mean and median loss amounts was driven by outlier large loss amounts – there were thirteen offenses in which the loss amount exceeded $150,000,000, one of which had a loss of more than $550,000,000.
The statistics in the FY2018 Sourcebook (as well as those from the FY2019 interim report) show DOJ’s increased focus on prosecuting immigration and firearms offenses and a continuing decline in federal drug and fraud prosecution efforts. For a closer look into some of the statistics within these four categories, click here.
Our next article will offer a more in-depth look into statistics about immigration offenders from FY2018. Please let us know if there are particular types of analysis you would like to see.
Ripley Rand is a partner in the Raleigh, North Carolina, office of Womble Bond Dickinson. Before joining the firm, Ripley served as the United States Attorney for the Middle District of North Carolina, a North Carolina state court judge, and a North Carolina Assistant District Attorney. Ripley advises and represents businesses and people dealing with governmental investigations, business disputes, regulatory matters, and corporate compliance issues.
David Palko is an associate in the Raleigh, North Carolina, office of Womble Bond Dickinson. Prior to joining the firm, David’s experience included serving as a federal appellate law clerk and as a Special Assistant United States Attorney for the Eastern District of North Carolina. He is now a member of the firm’s Business Litigation practice group and also serves in the U.S. Army Reserve.
*The Sentencing Commission announced in the FY2018 Sourcebook that it changed several methodologies in its statistical analyses of federal criminal offenders. One change it made was how it categorized offenders by the type of crime. Previously, the Commission used the statute of conviction to determine the type of crime; the count of conviction with the highest statutory maximum drove the primary offense category. For example, if an offender was convicted of a drug offense and a related firearm offense, the offender was categorized under the firearm offense since that crime has a higher statutory maximum penalty. With the FY2018 statistics, though, the Commission has moved to using the sentencing guideline with the highest offense level (how the federal courts classify crimes according to the severity of the offense) to determine the type of crime.
For the FY2018 Sourcebook, the Commission also recategorized the FY2017 offender numbers using this change in methodology. This retroactive change produced notable differences in some of the offender numbers. For example, the change resulted in an increase in the number of offenders categorized as having committed federal murder offenses during FY2017 from 72 to 354. The largest change came in cases with firearm offenses; the FY2017 firearms offender numbers dropped by over 1,300 offenders after the recategorization. This dramatic change was largely due to the recategorization of offenses involving the use or carrying of a firearm while committing another crime (such as a drug trafficking crime or a crime of violence); previously, those offenders were categorized as having committed firearm crimes, but they are now categorized in connection with the underlying crime of conviction to which the firearm crime was connected. Whenever we specifically refer to FY2017 data, we are going to use the recategorized data found in the FY2018 Sourcebook.
Notably, the Commission only provided recategorized numbers for FY2017. As a result, it is often not possible to make direct comparisons of FY2018 statistics with those from earlier years that were not produced with the current methodologies. In this article, we discuss the crimes contained in the four largest offense categories. Of these four major categories, however, only firearms had a marked shift under the new methodology; the other major offense categories did not have the same level of disparities. The FY2017 immigration offender numbers, for example, only increased by 0.4% from 20,421 to 20,496 offenders after the recategorization. Given the smaller changes seen in the immigration, drug, and fraud offense categories, we are comfortable noting the change in methodology and continuing to compare FY2018 data with that of years prior to FY2017 (the most recent year with the recategorized data). For those earlier years, it is admittedly not a perfect comparison, but it will still illustrate the general trends we are seeking to describe here. We also note that, in the FY2018 Sourcebook, the Commission often makes generalized comparisons of FY2018 offender numbers with offender numbers from previous years. So we are following suit with their approach.
More information on the recategorization is available on pages 28-31 in the Introduction to the FY2018 Sourcebook and in the section of Appendix A (the descriptions of datafiles and variables) addressing how the Commission defines the types of crimes. Thanks very much to the Sentencing Commission’s Office of Research and Data for its time and effort in providing additional insight into these changes.
Click here to return to the text of the article.


